
California’s political geography is diverse and plays a significant role in shaping the state’s political landscape. The majority of California leans Democratic, but there are varying political views throughout the state. Conservative Democrats are becoming rarer, while No Party Preference voters lean slightly more Republican. However, there are geographic patterns for certain issues, such as concerns about high taxes and support for immigrants. Registering all eligible residents to vote may moderate strongly partisan areas.
Key Takeaways:
- California’s political map exhibits a mix of party affiliations and viewpoints.
- The Democratic Party has strengthened overall, but variations exist throughout the state.
- Conservative Democrats are more common in the Central Valley.
- The Bay Area and Los Angeles are known for their strong Democratic support.
- The California Citizens Redistricting Commission aims to draw fair maps without considering party affiliation.
Party Strength in California
Party affiliations in California are complex. While the Democratic Party has strengthened in general, the state exhibits a mix of party leaning. The growth of independent voters, known as No Party Preference, has slightly shifted towards Republicans in some areas. Conservative Democrats are more common in the Central Valley, while liberals are a small share of Republicans across the state. The political demographics of California show a variety of views and affiliations.
California’s political map reflects the diverse political landscape of the state. From the liberal strongholds of the Bay Area and Los Angeles to conservative pockets in certain counties, the political affiliations vary across different regions. However, it is important to note that California leans more towards the Democratic Party overall.
The Central Valley stands out as an area with higher concentrations of conservative voters. This agricultural region has traditionally been more conservative compared to urban centers. However, it is essential to recognize that not all parts of the Central Valley are uniformly conservative. While political demographics can vary within regions, it is generally seen as one of the more conservative parts of California.
When examining the most conservative county in California, Modoc County often comes to mind. Located in the northeastern part of the state, Modoc County has a reputation for its conservative values and Republican leanings. However, it is worth noting that political demographics can evolve over time, and this ranking may change in the future.
The question of whether California is a republic or a democracy is often posed. California, like the rest of the United States, operates as a democratic republic. It follows a representative democracy system, where elected officials make decisions on behalf of the people. Citizens have the right to vote for their representatives and participate in the democratic process.
Political Demographics of California
Understanding the political demographics of California is essential to comprehend the state’s political landscape. While California leans more towards liberal perspectives, it is not entirely homogeneous in its political views. There are pockets of conservatives spread across the state, particularly in the Central Valley and rural areas.

Party strength varies at the county level, with some counties being more conservative or liberal than others. The political demographics can be influenced by a variety of factors, including economic conditions, cultural influences, and historical voting patterns.
It is important to note that political demographics can change over time. Shifting demographics, new policy debates, and evolving social attitudes can shape the political landscape of California. It is a dynamic state with diverse perspectives and continuous political change.
Geographical Trends in Party Affiliation
The political map of California provides a fascinating insight into the regional variations in party affiliation across the state. Different areas exhibit distinct political leanings, shaping the overall political geography of California.
In the Bay Area and Los Angeles, there is a strong Democratic support, with these regions being known as Democratic strongholds. The central and south coast regions, too, are trending in a similar direction, favoring the Democratic Party. However, within these regions, there are also subtle differences.
The central Los Angeles area, for example, tends to be more Democratic than other parts of the city. On the other hand, in the far East Bay, the Democratic presence is slightly less impactful compared to the rest of the Bay Area.
Another noteworthy region is the Central Valley, where the northern and central parts demonstrate a stronger Democratic affiliation compared to the southern portion. This division within the Central Valley highlights the complexity of political geography within California.
Shasta County, located in the far north, stands out for its support of former President Trump. This divergence from the broader trend showcases the political diversity within the state.
The regional variations in party affiliation portrayed by the political map of California contribute significantly to the overall political landscape of the state. Understanding these geographical trends is crucial for analyzing California’s political boundaries and divisions.
Impact of Party Affiliation on Elections
Party affiliation plays a crucial role in shaping the outcome of elections in California. The distribution of congressional and state assembly districts is directly linked to the state’s political boundaries. Candidates and voters can gain valuable insights by examining the detailed political map of California, which showcases the unique characteristics of each district. This understanding enables political campaigns to strategically target specific areas and tailor their strategies accordingly.
California’s political boundaries are defined by the California Congressional District map and the California State Assembly District map. These maps outline the geographic divisions where elections take place, allowing candidates and voters to navigate the complex political landscape of the state.
Moreover, political maps that display counties in California and major cities provide a visual representation of the political composition within the state. By analyzing these interactive political maps, individuals can observe the distribution of party affiliations across different regions and better comprehend the overall political dynamics of California.

Fairness of California’s Redistricting Commission
The California Citizens Redistricting Commission was established with the aim of creating fair and impartial political maps for the state. However, there are growing concerns about the commission’s ability to achieve this objective. While the commission takes into account factors like population equality, majority-minority districts, geographic contiguity, and geographic compactness, it does not consider party affiliation when drawing the maps. This has led to debates about the fairness of the results.
Some argue that the increasing “Difference” between the popular vote share of political parties and their seat share is a result of the maps being drawn in favor of one party. However, it is worth noting that the commission’s maps have been found to be more fair compared to maps drawn by politicians.
The fairness of the redistricting process is crucial for ensuring adequate representation and balanced political demographics. While the commission’s efforts to prioritize certain factors are commendable, the omission of party affiliation has raised concerns about potential bias and manipulation.
Efforts to analyze the impact of the redistricting process on California’s political landscape continue, with ongoing discussions on the role of party affiliation, the accuracy of representation, and the importance of political demographics. Achieving a fair and transparent redistricting process remains an ongoing challenge.
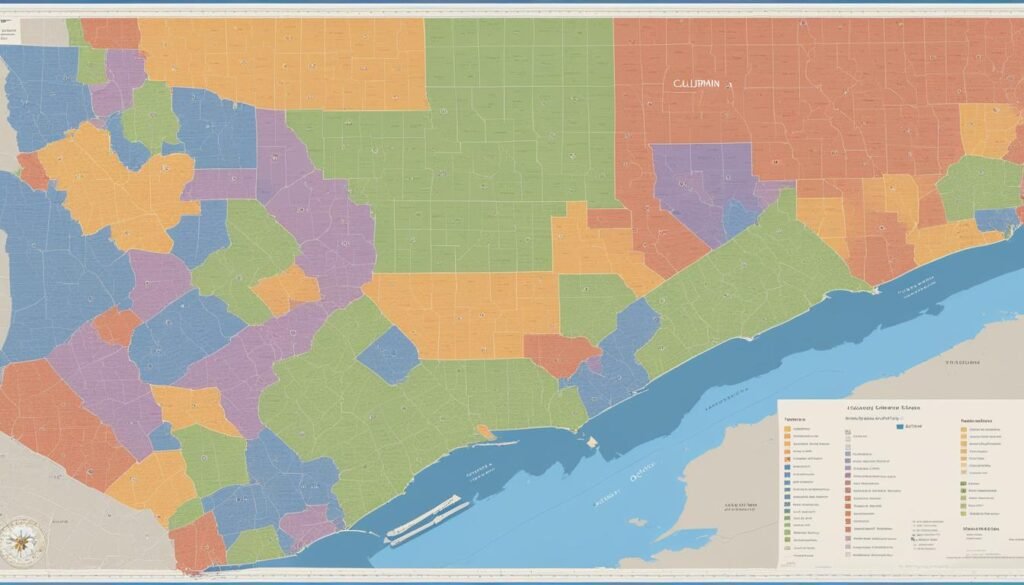
To visualize the political boundaries in California, take a look at the California County Political Map. This map provides an overview of the diverse regions within the state and their respective political demographics.
Understanding the intricacies of California’s political geography is essential for comprehending the state’s political landscape as a whole. By considering factors such as California’s political boundaries, party affiliation, and political demographics, we can gain valuable insights into the dynamics that shape the state’s political landscape.
Impact of California’s Congressional Map
The recently certified congressional map in California maintains a similar mix of Democratic-leaning and Republican-leaning seats as the previous map. Despite Democrats losing a seat due to reapportionment, most incumbents were able to retain their positions with slight shifts in their districts. Republican representatives now face less favorable districts, while a third of the new districts are majority-Hispanic, reflecting the state’s growth in Hispanic communities. Overall, the new map remains moderately biased toward Democrats.
The impact of California’s congressional map is crucial in determining the political landscape and representation in the state. The recent changes provide insights into the dynamics between Democrats and Republicans, revealing a continuation of the previous map’s distribution of seats. However, the slight shifts and reapportionment have resulted in a loss for Democrats and the need for Republican representatives to face new challenges in less favorable districts.
Furthermore, the significant presence of majority-Hispanic districts highlights the growing influence and representation of Hispanic communities in California. As the state’s demographics continue to evolve, it is important for the congressional map to reflect the diversity and interests of its residents.
While the new congressional map maintains a moderate bias toward Democrats, it is essential to recognize that political landscapes can shift over time. The dynamics of elections, changing demographics, and evolving political ideologies can potentially influence the distribution of seats in future maps.
Comparison with Other Independent Redistricting Commissions
When it comes to the redistricting process, California shares similarities with Arizona, as both states have independent redistricting commissions. However, a comparison between the two reveals that California’s maps have been found to be less fair than those of Arizona. Independent redistricting commissions, including California’s, have made efforts to reduce partisan unfairness compared to maps drawn by politicians.
The ultimate goal of these commissions is to create fair maps that align with voters’ beliefs and priorities. While this remains a challenging task, the use of independent commissions and court-drawn maps has shown promise in reducing gerrymandering. It is a step towards achieving more equitable and representative political boundaries.
Reducing Partisan Bias
Independent redistricting commissions, such as the one in California, aim to minimize partisan bias by prioritizing the principles of fairness and impartiality. Instead of considering party affiliation, these commissions focus on factors like population equality, geographic contiguity, and compactness. By doing so, they strive to create electoral districts that accurately represent the demographics and geographic features of a region.
Enhancing Voter Representation
The use of independent commissions and court-drawn maps can help address the challenge of gerrymandering, which often distorts the will of voters. By prioritizing fairness and removing partisan influence, these commissions contribute to a more representative democratic process. The political map of California, as well as those of other states with independent commissions, aims to empower voters and ensure their voices are accurately heard in the democratic process.
In conclusion, while California’s redistricting process is not without its criticisms, it shares a common goal with other states’ independent redistricting commissions to create fair and representative political maps. By employing strategies that reduce partisan bias, such as the use of independent commissions and court-drawn maps, there is hope for a more equitable political landscape. Efforts to improve the rigidity of gerrymandering and enhance voter representation are ongoing and vital to ensuring a truly representative democracy.
Conclusion
The political map of California is a reflection of the state’s diverse and complex landscape. While the overall leanings of the state tend to be Democratic, there are pockets of conservative counties and varying party affiliations throughout the different regions. This political geography has a significant impact on elections and representation in California.
The California Citizens Redistricting Commission strives to draw fair maps that are not influenced by party affiliation. However, there have been criticisms regarding the fairness of these maps. Some argue that they are drawn to favor one party over another, leading to concerns about the commission’s objectivity.
Despite the challenges, the commission’s maps have brought about changes in district favorability for both Democrats and Republicans, affecting incumbent lifelines. The ongoing efforts to achieve fairness and representation in California’s political landscape are shaped by the state’s unique political geography.
It remains crucial to recognize the role of the California Citizens Redistricting Commission in shaping the state’s political map and the ongoing discussions surrounding its fairness. The impact of these maps on elections and representation cannot be underestimated, and the quest for fairness and equal representation in California’s political system continues.
FAQ
What is the political map of California?
The political map of California refers to the distribution of party affiliations and voting patterns across the state. It shows the varying degrees of support for Democratic and Republican candidates in different regions of California.
Are Democrats or Republicans more prominent in California?
Democrats hold a stronger presence in California overall, but there are areas with more conservative views and Republican support. However, the majority of the state leans Democratic in terms of party affiliation.
Which parts of California are considered the most conservative?
While California is generally more liberal, some counties, such as Shasta County in the far north, have a stronger conservative presence. These conservative counties are exceptions to the general liberal trend in the state.
How does the political geography of California influence party affiliation?
The political geography of California plays a significant role in shaping party affiliation. Certain regions, such as the Bay Area and Los Angeles, are known for their strong Democratic support, while other areas may lean more Republican. These regional differences contribute to the overall political landscape of the state.
How do political boundaries affect elections in California?
Political boundaries in California, including congressional and state assembly districts, influence election outcomes. By understanding the political map, candidates and voters can gauge the political landscape of each district and tailor their strategies accordingly.
Is California’s redistricting process fair?
California has implemented an independent redistricting commission to draw fair maps. While the commission prioritizes factors like population equality and geographic contiguity, it does not consider party affiliation. However, compared to maps drawn by politicians, the commission’s maps have been found to be more fair.
How does California’s congressional map impact party representation?
The recently certified congressional map in California maintains a mix of Democratic-leaning and Republican-leaning seats. Despite Democrats losing a seat due to reapportionment, most incumbents were able to retain their positions with slight shifts in their districts. Republican representatives now face less favorable districts.
How does California’s redistricting process compare to other states with independent commissions?
California’s redistricting process is similar to that of other states, such as Arizona, which also has an independent redistricting commission. However, California’s maps have been found to be less fair compared to Arizona’s. The use of independent commissions and court-drawn maps shows promise in reducing gerrymandering and creating fair representation for voters.